By Jacob Moore
Well before I entered the world of weaving I had a career in the biological sciences. I spent a great deal of time thinking about ways to represent data visually, and while I no longer work in the sciences, my interest in data visualization has remained. So, when I first encountered the idea of a temperature blanket, I knew I would eventually create one, though it took me many years before I discovered the exact form my blanket would take.

Most commonly created through knitting or crochet, temperature blankets contain a row or square for each day of the year, with the color of the yarn for that day determined by that day’s average temperature. At the end of the year, the blanket becomes a picture of the year’s temperatures. If it was a particularly hot year, the blanket will emphasize the warmer colors (usually reds and oranges), while if it was a particularly cold year, the blanket will emphasize the cooler colors (usually blues and purples). These creations are also not limited to average temperatures - many variations exist that incorporate minimum and maximum daily temperatures, sunlight hours, or daily weather conditions like snowfall or rainfall. Some even incorporate all of these variables into a single blanket. Here is a stunning crochet example by Maggie Carroll @nyhem_crochet.
While a single blanket is neat in its own right, many artists and organizations have used this concept as a means of exploring climate change. For example, the Tempestry Project is a community-supported project where individuals create “tempestries” (temperature tapestries) using consistent colors at different locations at various points in time. The end result is a striking visual of how the temperature at these places has been impacted by the changing climate.

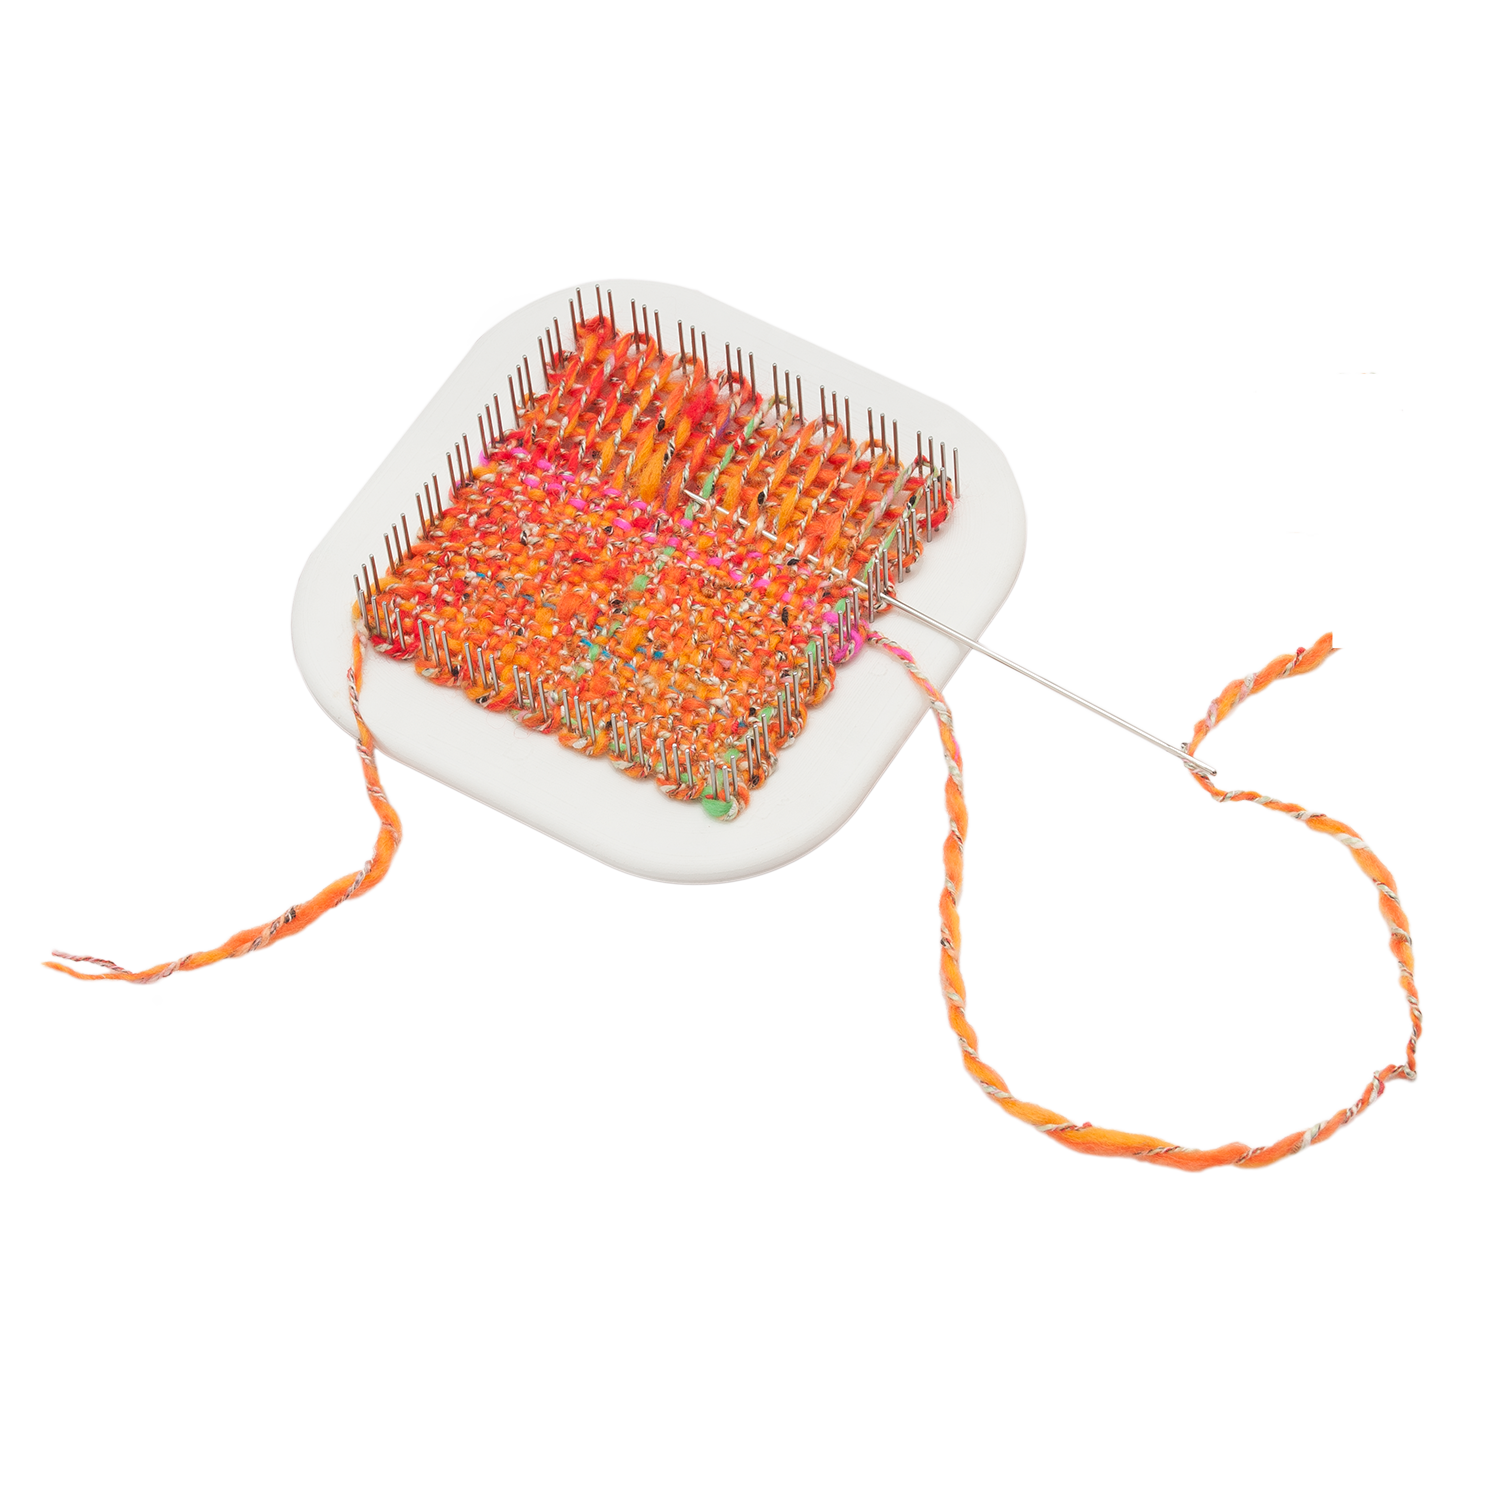
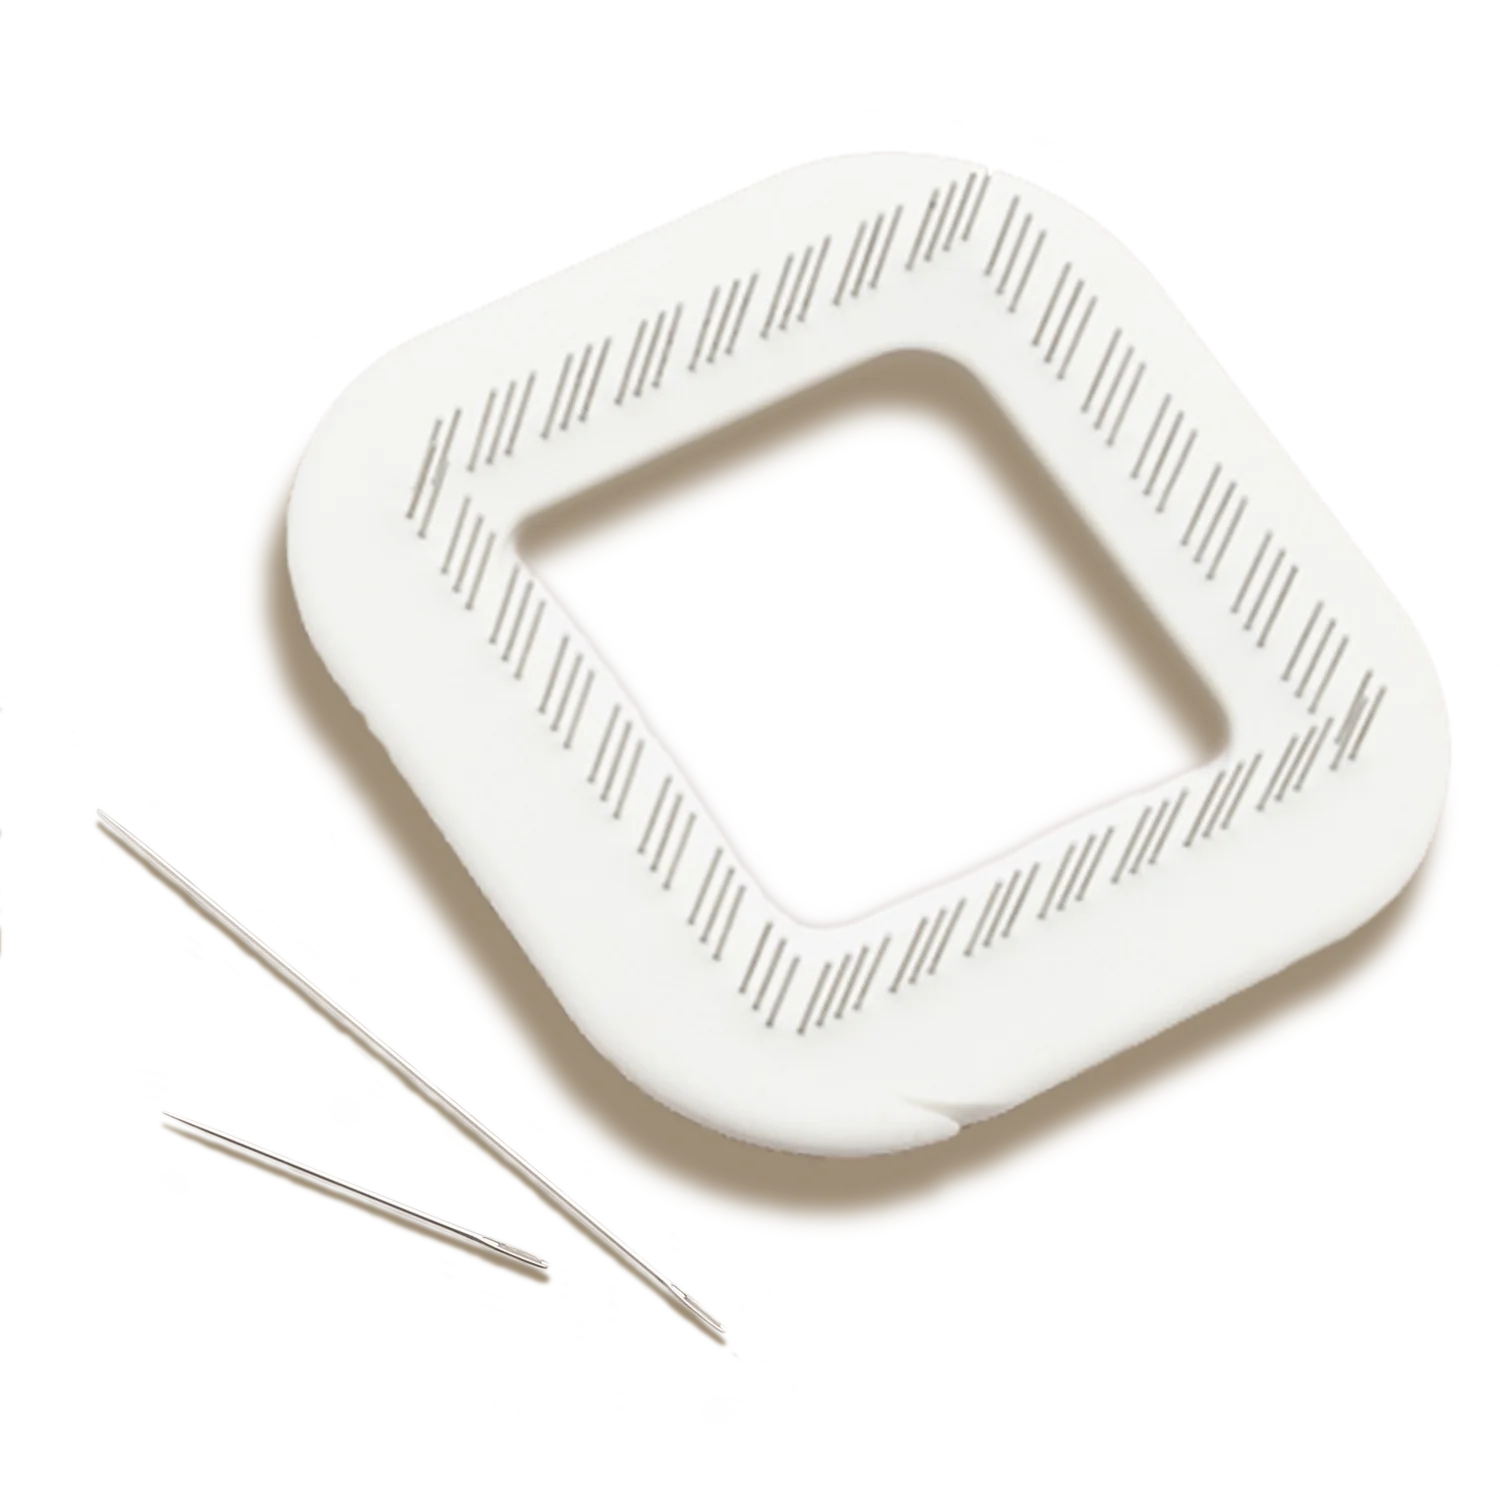
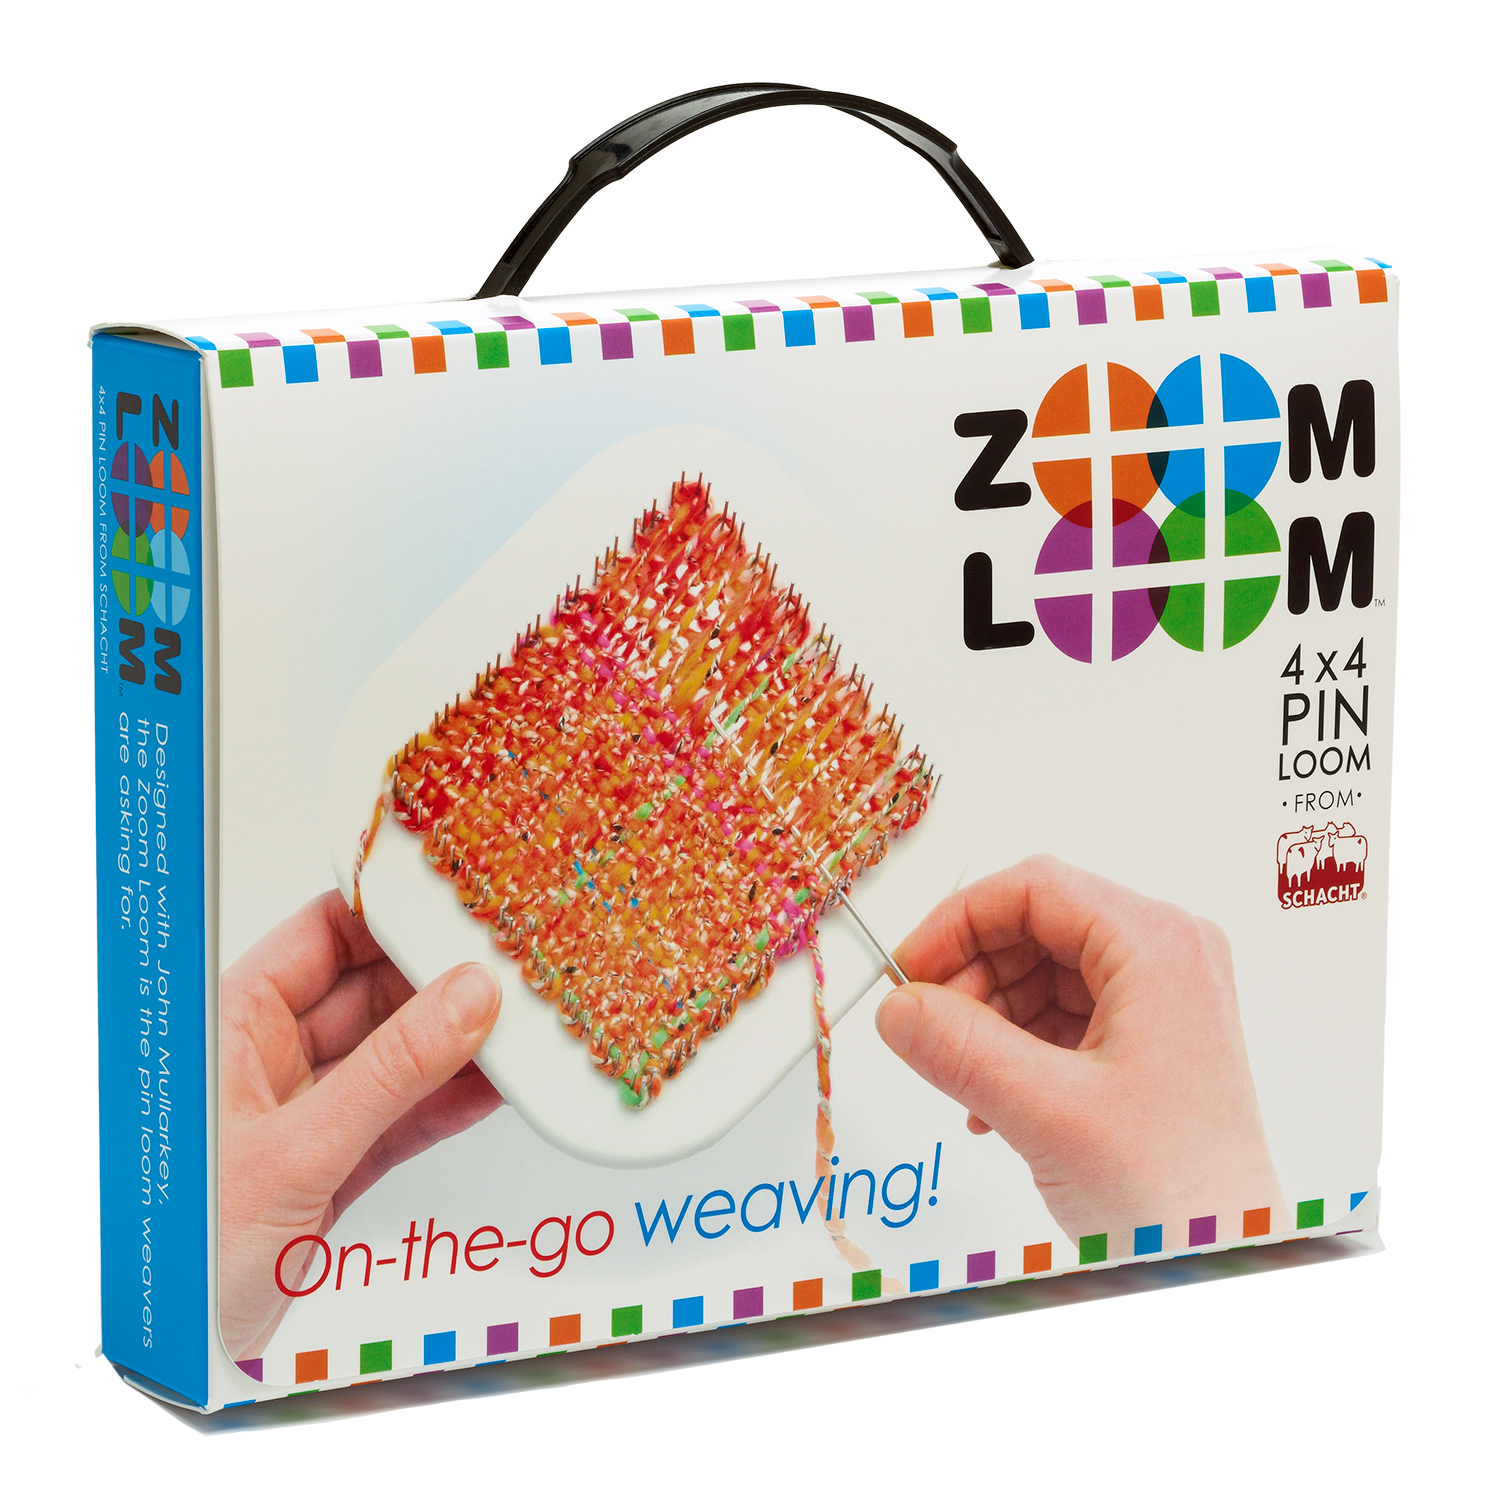
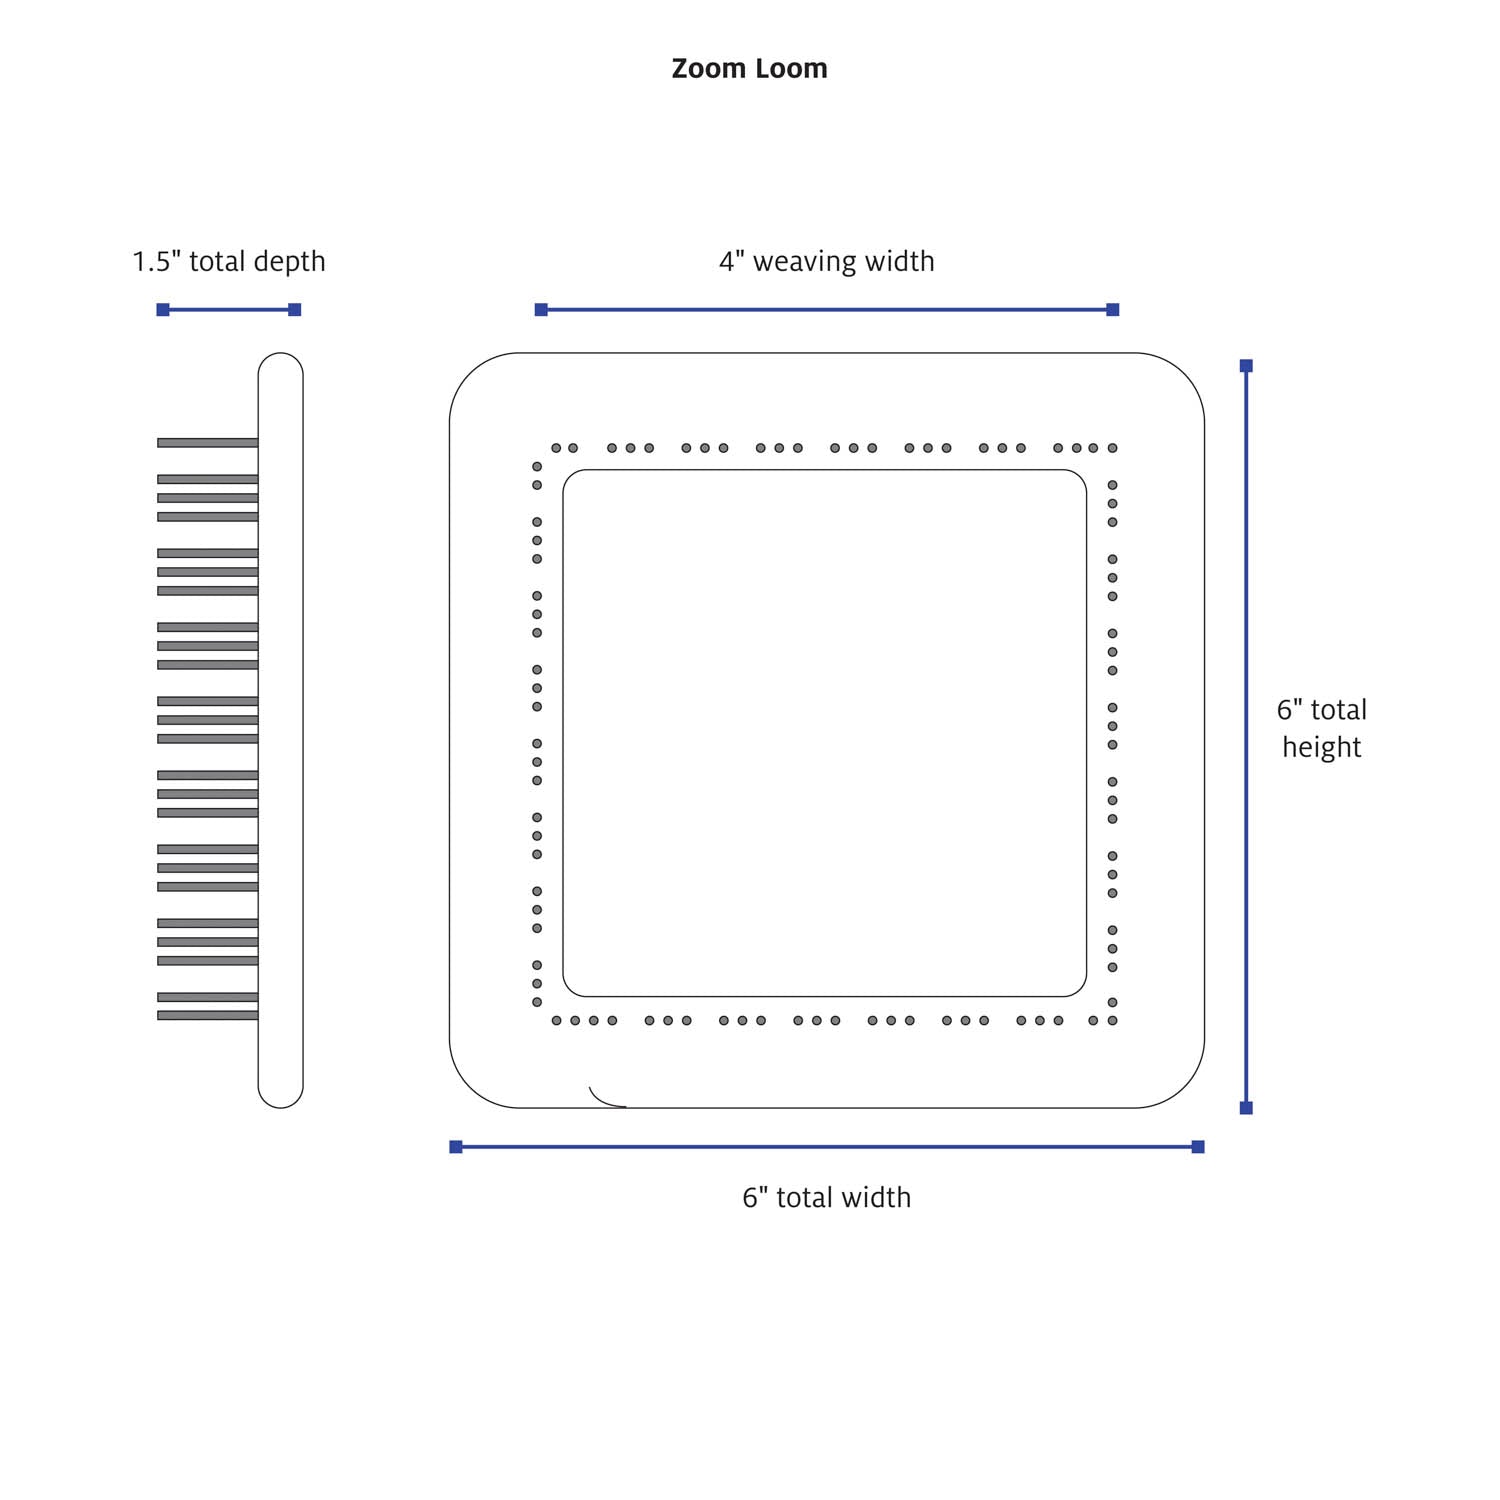
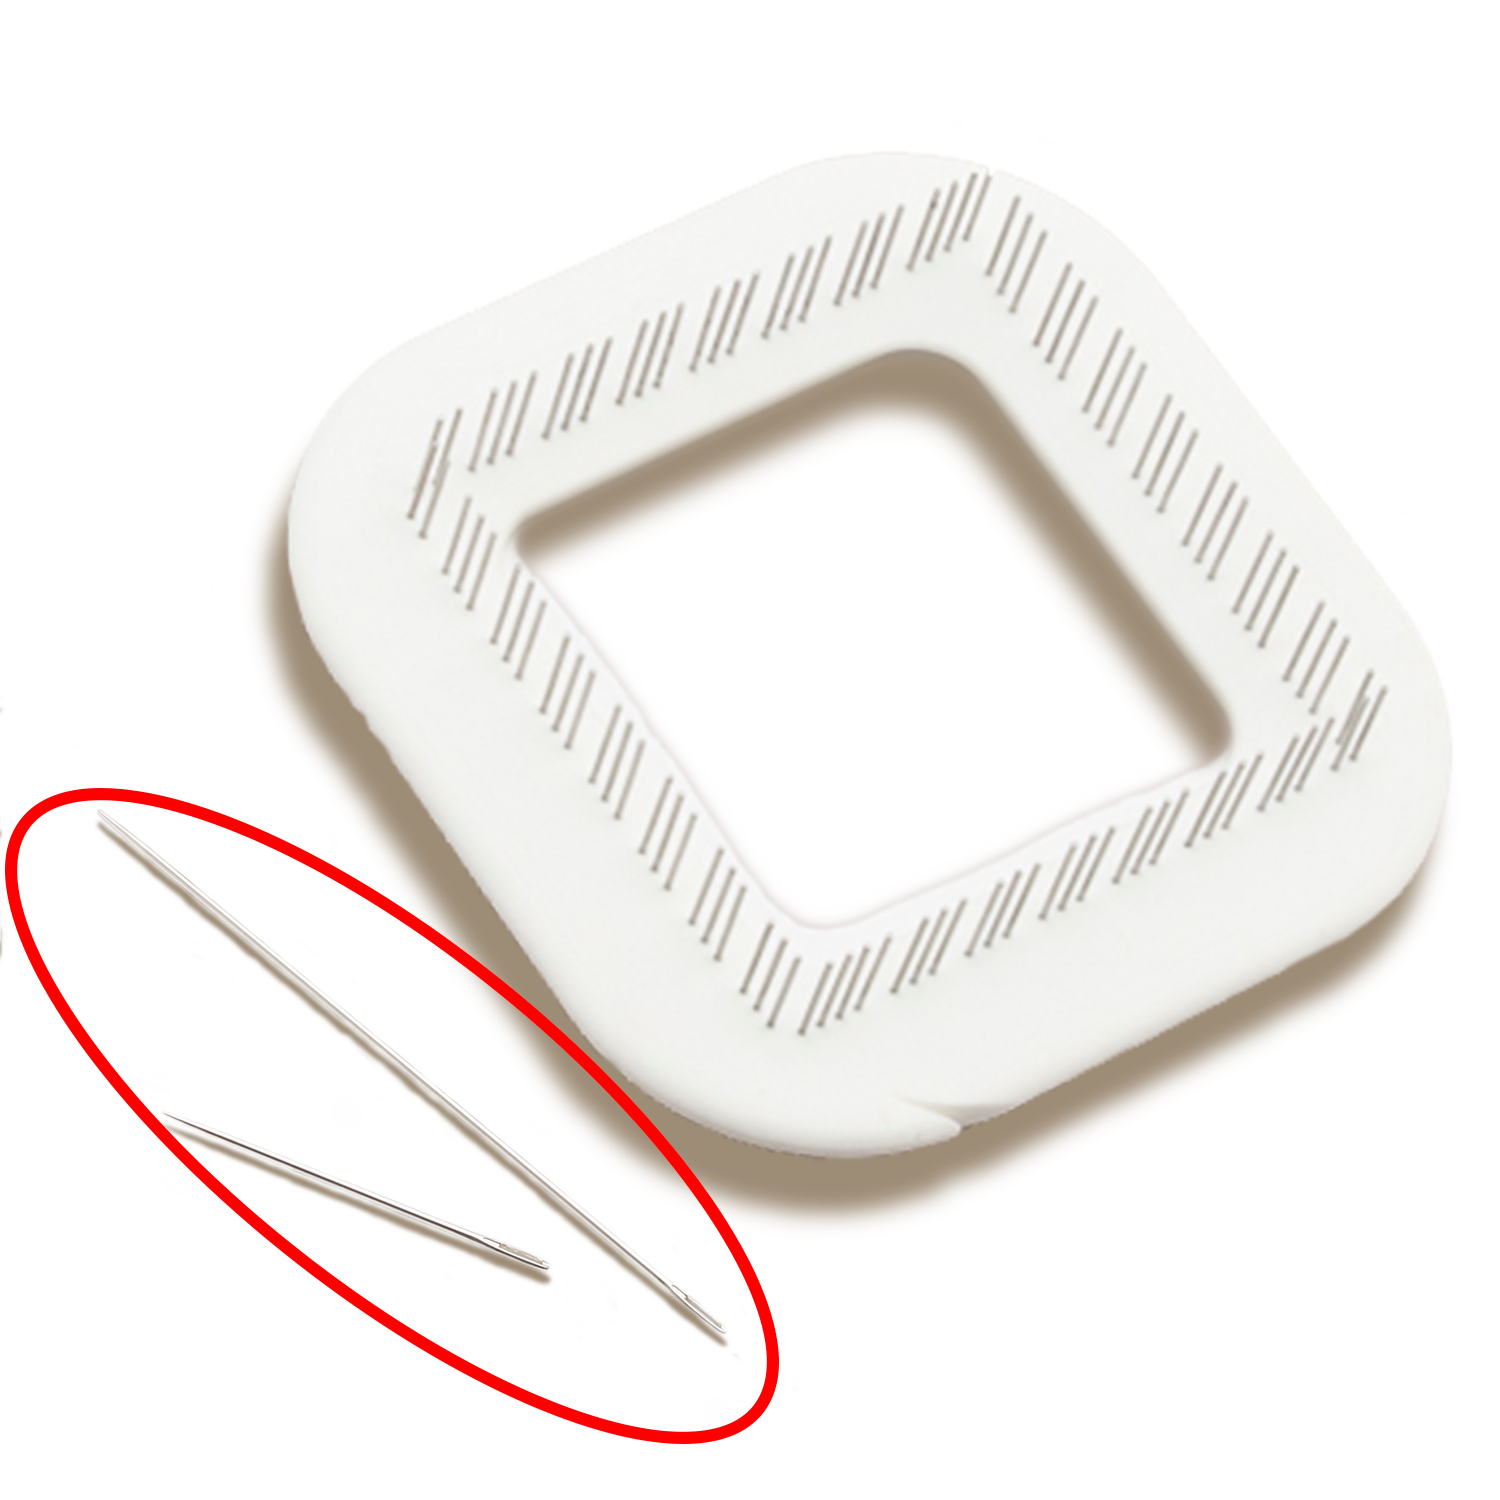
I began my own temperature blanket in 2022. I had started my weaving journey the year before after taking a virtual weaving class through the Weaver’s Guild of Minnesota. I had yet to get a larger floor or table loom, and was instead experimenting with smaller, portable looms. When I came across the Schacht Zoom Loom, I knew immediately that it was the perfect tool for the blanket. Using this pin loom, I could weave one 4”x 4” square per day, and then assemble the squares together at the end of the year to create the final piece.
At this point, I began planning. I wanted to use temperatures from my current home in the Twin Cities, Minnesota, and used data pulled from the official temperature station at the MSP International Airport. Using historical temperature data from that location, I determined that a range of -14 degrees F to 105 degrees F would likely capture the full range of temperatures I may experience in 2022.

Before I could assign colors to each temperature range, I next had to decide upon my yarn. This is where sampling became important. After some fun browsing at a local yarn store, I narrowed down my options to about 5 brands of yarn that had a large range of colors in my desired hues. While most temperature blankets use a full rainbow of colors, my preferences tend toward cooler hues, so I decided to use greens for warmer temperatures and blues for the cooler temperatures. Next, I wove several squares with each yarn brand, then wet finished them in a variety of ways to get a sense for how much the blanket would shrink, and how soft the final result would be. Cascade 220 wool yarn was the clear winner, with a large selection of colors, minimal shrinkage, and an incredibly soft finish.

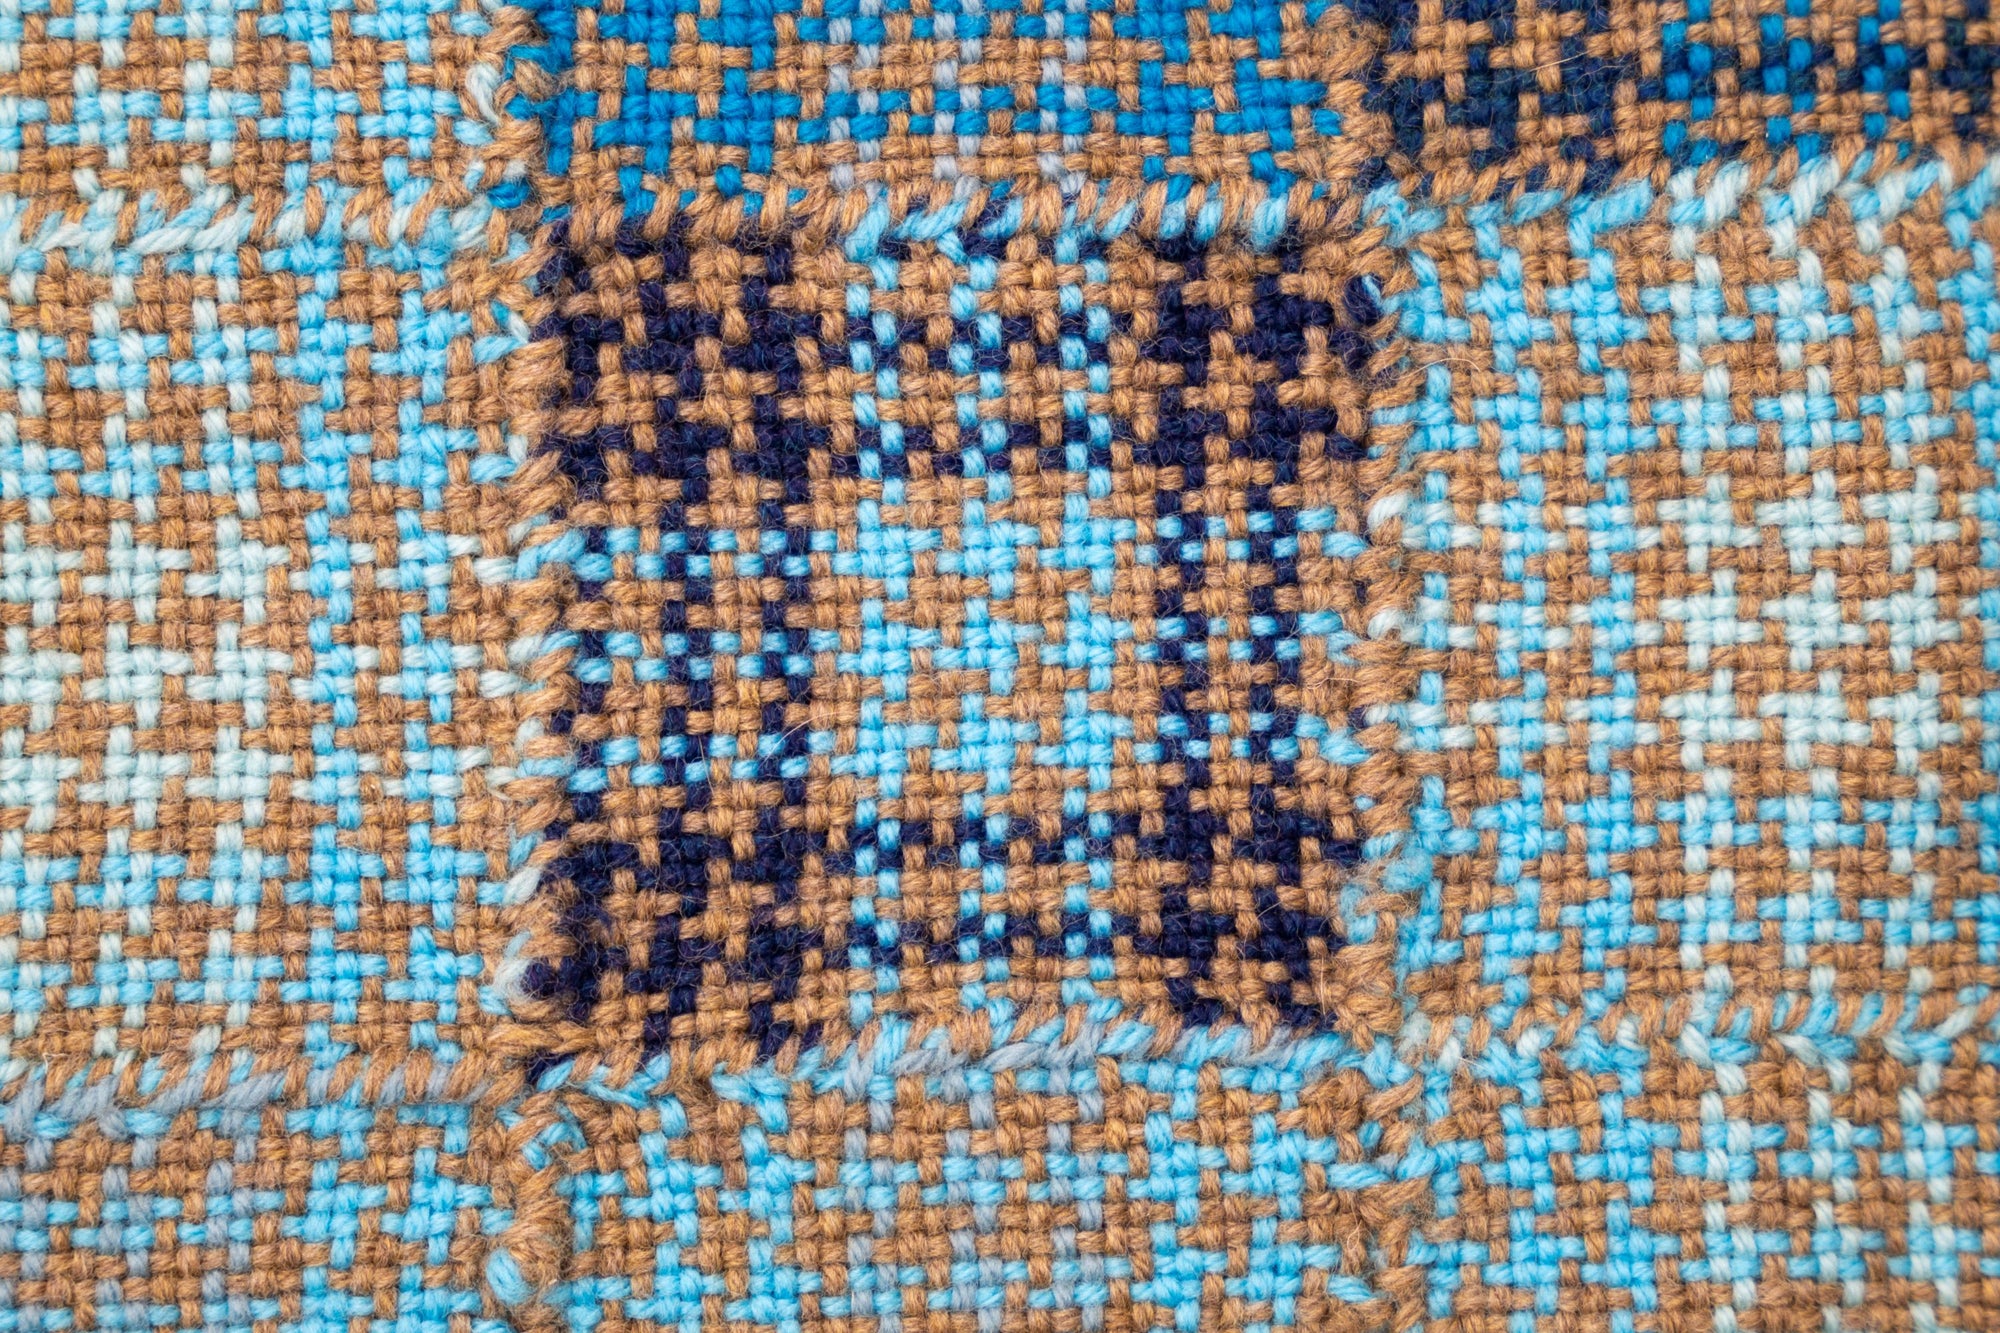
With my colors set, the next big decision was the weave structure to use for each square. I wanted to capture both the minimum and maximum temperatures of the day, and also include a single color that would be present in every square to provide consistency across the blanket. I came across Sue Burton’s fantastic tutorial on weaving a houndstooth pattern on the pin loom, and decided I would use that structure. I experimented with different ways of incorporating the third color into the basic houndstooth design - stripes, half-and-half, blocks - and landed on a design that would place blocks of the maximum temperature on the outermost corners of the square, and a block of the minimum temperature on the inside of the square. Blocks along the sides would be an intermingling of the minimum and maximum temperature colors.

With all the decisions made, it was finally time to start weaving! One intention with these temperature projects is to spend time each day on the project, bringing mindfulness and attention to the present. And after catching up (it was late February when I finally started weaving my squares), I did manage to weave a square per day for several months. But of course life’s pace is not constant, and there were many times I didn’t weave for months. Even with that though, I found my attention turning more often to the present and the nuances of a given day.

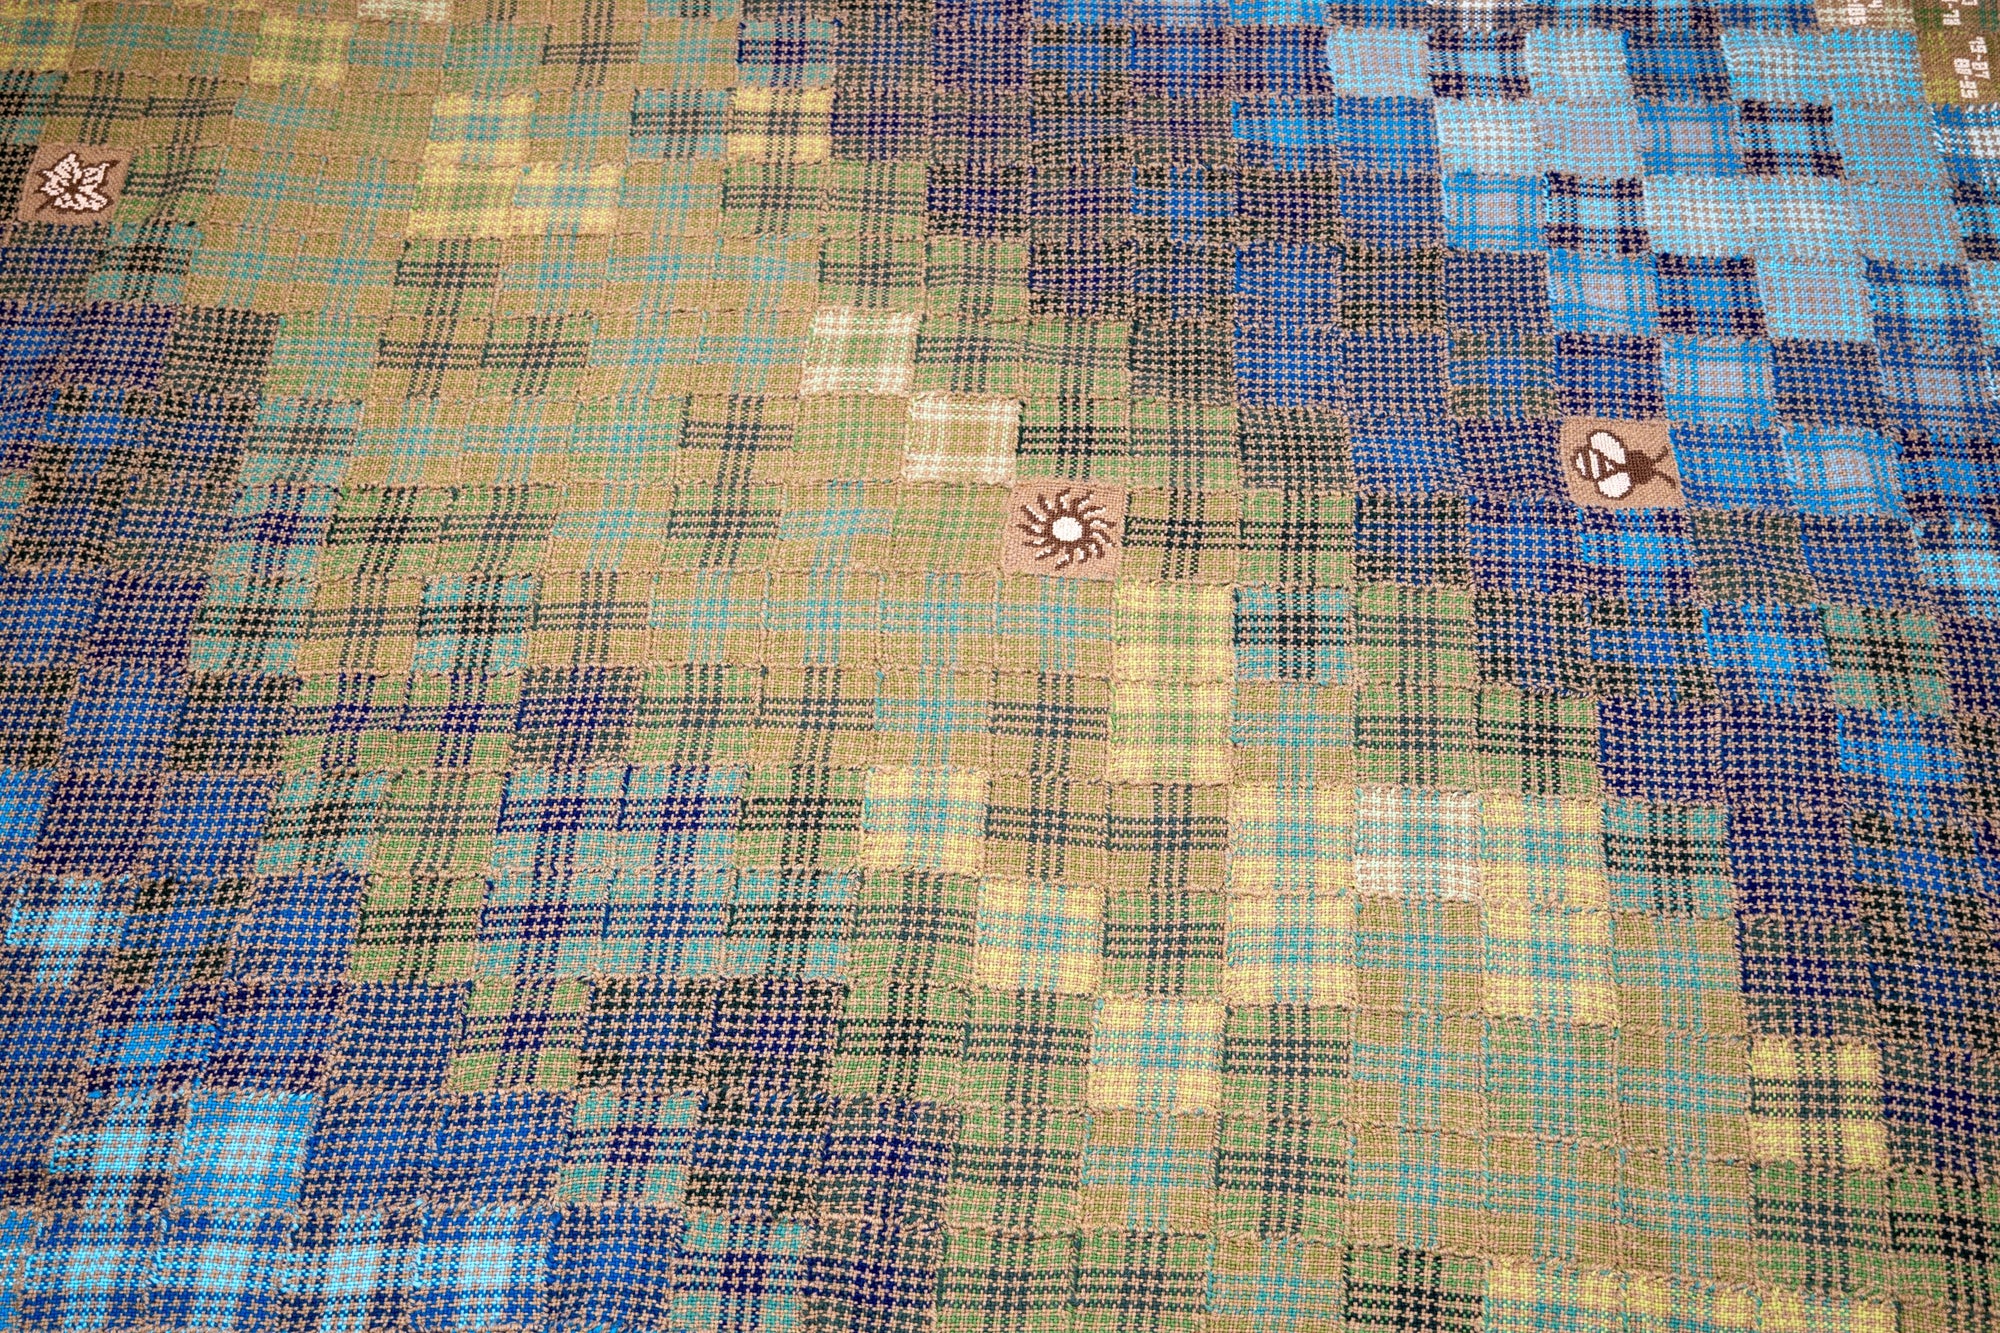
I competed the final 365th daily square shortly after the beginning of 2023. At this point, more decisions needed to be made. There wasn’t a good way to divide 365 squares into a blanket-shaped rectangle. So, I added 13 squares to bring the total to 378, allowing me to make a blanket 18x21 squares across. I used these extra squares to represent additional pieces of data: with four squares I added cross stitch patterns to a plain weave to represent the two equinoxes and two solstices; with one square I cross stitched the location and year of the data on a plain weave square; and with the remaining eight squares I cross stitched the specific temperature range on top the matching yarn color to provide a color-temperature legend. For assembly, I chose a simple whipstitch, joining the squares diagonally, beginning with January 1st in the top left corner and ending with December 31 in the bottom right corner.

After wet finishing, the final blanket measured approximately 84”x70”, and contained squares representing temperatures from -17 degrees F to 103 degrees F (I unfortunately didn’t get to use my hottest temperature color). At a quick glance you can see days that were particularly hot or cold, as well as large stretches where very little changed.
Beyond the excitement of seeing the final blanket come together, one of the best parts of this project has been the joy of sharing it with others. I’ve been honored to display the blanket at an exhibit hosted by the North Suburban Arts Center in Fridley, MN, as well as at the Minnesota State Fair in 2023. Through these exhibitions, and sharing the project with my local Guild, I’ve been able to engage with so many different people, sharing our love for weaving and artistic expression.

Additionally, I taught my mom, Tamra Moore, to weave on a Zoom Loom so she could create her own temperature blanket. She chose a more traditional color palette and a crochet join, but followed my design for everything else. She created two blankets using 2022 temperature data - one for her location in Denver, Colorado, and one using the same Twin Cities temperature data I used. It’s been fascinating to see how using a different color palette changes the look of the blanket, as well as to compare the final blankets from Denver and Minneapolis. It’s been such a joy seeing her creations come to life, and being able to share my love of weaving with her.
Will I end up making another temperature blanket? Probably. I’m interested in creating a blanket from 20-30 years ago, plus another 20-30 years from now to get a sense for the impact of climate change on my current home. But, I’ll give it a few years before returning to such a large project. In the meantime, I’m exploring other methods of using weaving to represent the world around us. My current pursuits are the creation of temperature bands using tablet weaving brocade, as well as experimenting with how I can incorporate daily weather patterns onto a floor loom design with clasped weft and other techniques. The possibilities are endless!

